As Environmental, Social and Governance data grows in popularity, many investors find themselves asking the question “is ESG data material?” Or “can ESG data be predictive of total returns?”. As an ESG data provider, OWL is asked those questions almost daily. To explore the first question, “is ESG data material”, we conducted an extensive correlation study to determine which of our ESG metrics – our KPIs – had statistically significant rank order correlations to financial metrics such as earnings growth, sales growth, book growth, profit margins, etc. known to be predictive of total returns. The results were intriguing, though expected since ESG disclosure is sparsely regulated and far from standardized. For different region-sector, region-subsector and region-industry groupings, different OWL KPIs correlated to differing financial metrics to varying degrees. In some cases, a KPI that had a statistically significant positive correlation to an important financial metric in one group would have a statistically significant negative correlation to the same financial metric in a different group. Knowing that our KPIs seem predictive of certain financial metrics for different groupings of companies, we asked ourselves if they are also be predictive of total returns in and of themselves for those same groupings of companies.
In our “Sector Spotlight” series, OWL intends to answer that question. Given what we learned about ESG data from our extensive correlation study, it does not logically follow that ESG data as a whole can be applied to the market as a whole. Different ESG factors have differing levels of importance in a portfolio context given the make up of that portfolio. To keep things simple, we decided to focus this series on the North American region to determine the efficacy of predicting returns of a subset of KPIs at the sector level. We hope this series will help investors to construct better North American ESG portfolios.
Previously, we found that a subset of 4 KPIs (3 Employer and 1 Citizenship KPI) all had a positive rank order correlation to financial fundamentals that every day investors use to determine their best investment opportunities. In this first “Sector Spotlight”, we focus on the Health Care and Industrials sectors.
To determine the power of the KPIs in predicting returns, OWL began with a simple linear regression model. OWL found that CIT1 (Community & Charity) and EMP3 (Education & Work Conditions) KPIs had positive linear regression coefficients of 0.021% and 0.19%, respectively for the Health Care sector, while EMP1 (Compensation & Satisfaction) and EMP2 (Diversity & Rights) had coefficients of -0.052% and -0.034%. For the Industrials sector, EMP2 and EMP 3 had positive coefficients of 0.008% and 0.054% respectively, with negative coefficients for CIT1 and EMP1 of -0.094% and -0.021%. Please note that each of our KPIs are scored from 0 to 100.
What does this mean? In laymen’s terms, for every 1 point increase in the CIT1 KPI score for a Health Care sector company, the company was expected to see a 0.021% increase in quarterly returns, while for every 1 point increase in the EMP3 KPI score for the same company would lead to an expected increase in quarterly returns of 0.19%. Therefore, if a portfolio was constructed with only those Health Care companies that exceeded their peers in their CIT1 and EMP3 KPIs, the expected return of the portfolio would be greater than that of a portfolio that included all companies in the Health Care sector. The same would be expected for a portfolio of Industrials companies that had EMP2 and EMP3 KPI scores that exceeded their peers.
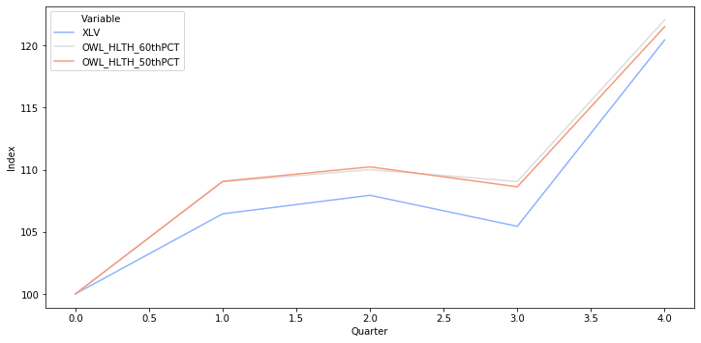
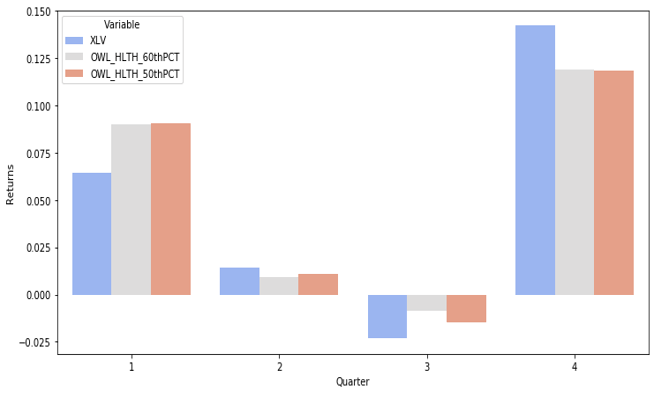
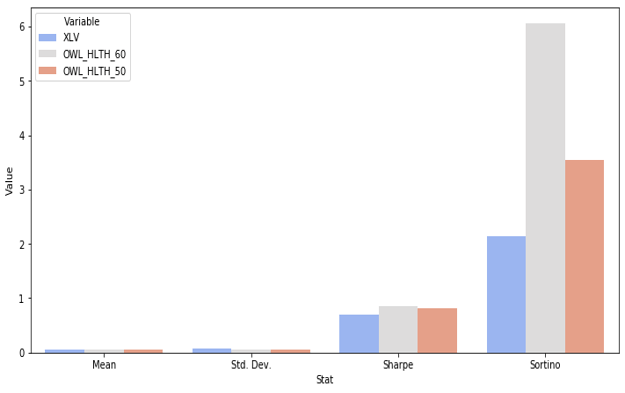
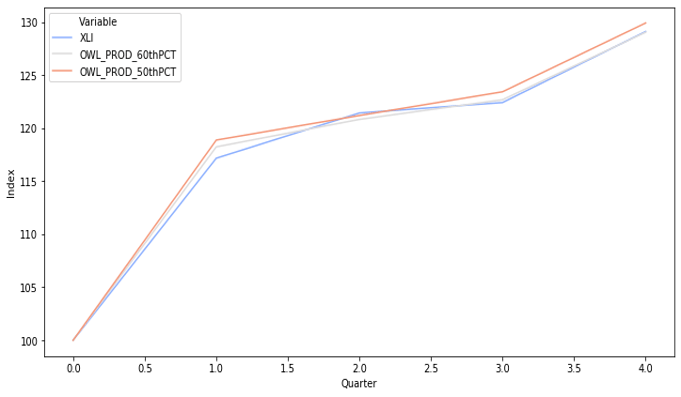
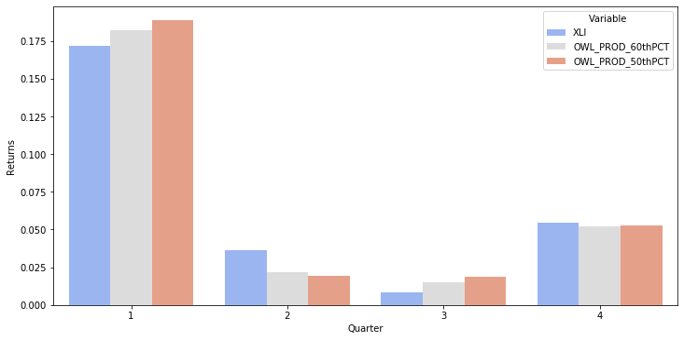
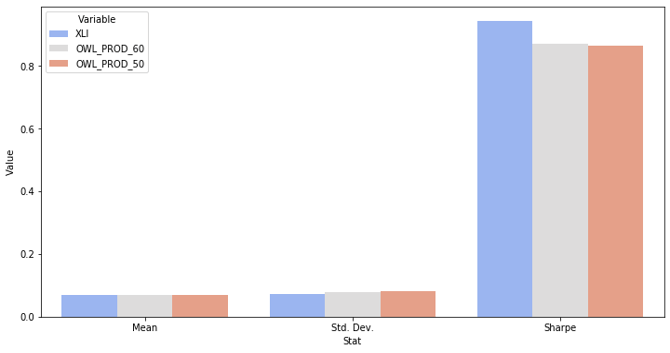
Given that the study dates were from 2016 to 2018 (the 3-year period leading up to 2019), would that hold true on a forward-looking basis if applied to the construction of a portfolio? OWL wanted to find out. To do so, OWL built two mock portfolios beginning on January 1st 2019, rebalancing quarterly, and ending December 31st 2019, for each sector. The first in which only companies that scored in the 60th percentile or higher in both KPIs that showed positive predictive power in the linear regression model made it through, both at the start and on quarterly rebalances. The second portfolio was constructed similarly, but with the threshold was lowered to companies that were in the 50th percentile or higher (above average). The portfolio was then market cap weighted, and the total returns, volatility and risk adjusted returns were compared to the relevant Sector SPDR ETF.