
Our series of case studies continues! Today we look at a simulated large-cap portfolio of the 1000 largest US companies, charting the comparison between two different weighting schemes.
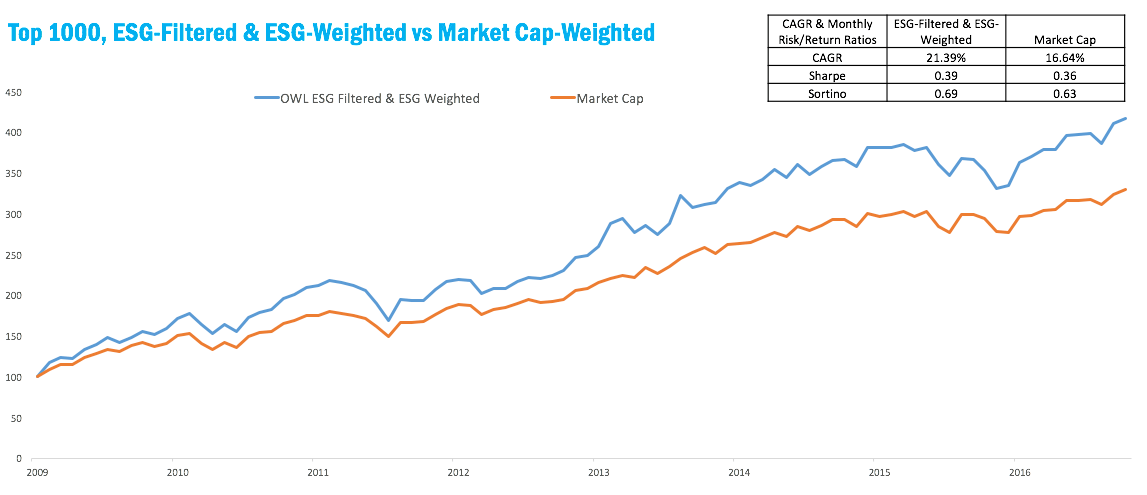
The red line represents a market cap-weighted portfolio, which is just that: constituents are weighted by their market capitalization, with no filtering or other factors.
The blue line represents the same 1000 companies with two ESG factors: companies whose scores are below the median OWL ESG Score are filtered out, and the remaining companies are weighted by their OWL ESG Scores.
Compared to the cap-weighted portfolio, the ESG-filtered/weighted portfolio significantly enhances total returns and risk-adjusted returns as measured by both Sharpe and Sortino ratios.
However, it’s interesting to note that adding the ESG filter does not improve portfolio performance. Revisit last week’s case study[link] to see how similar the performance is. At the end of the test period, the filtered-and-weighted portfolio value has risen to 417.36, while ESG-weighting alone saw its value rise to 432.31.
Disclosure: March 31, 2009 is the first date that the OWL ESG historical database begins. The top 1000 US companies are not all covered in the OWL ESG database. Any companies not covered received a weight of 0.00% and their performance is not reflected in the OWL ESG-weighted simulated portfolio. Factor exposures other than ESG score, such as market capitalization, valuation ratios, and momentum have an effect on performance as well. Past performance is in no way indicative of future results.
2 thoughts on “ESG Case Study: Adding a Filter”
Comments are closed.