
OWL ESG continues to publish case studies that convince us of ESG’s potential to improve investments. We will be releasing these updates regularly, and will present additional studies and analysis in our newsletter — take a second to sign up to receive this additional valuable information.
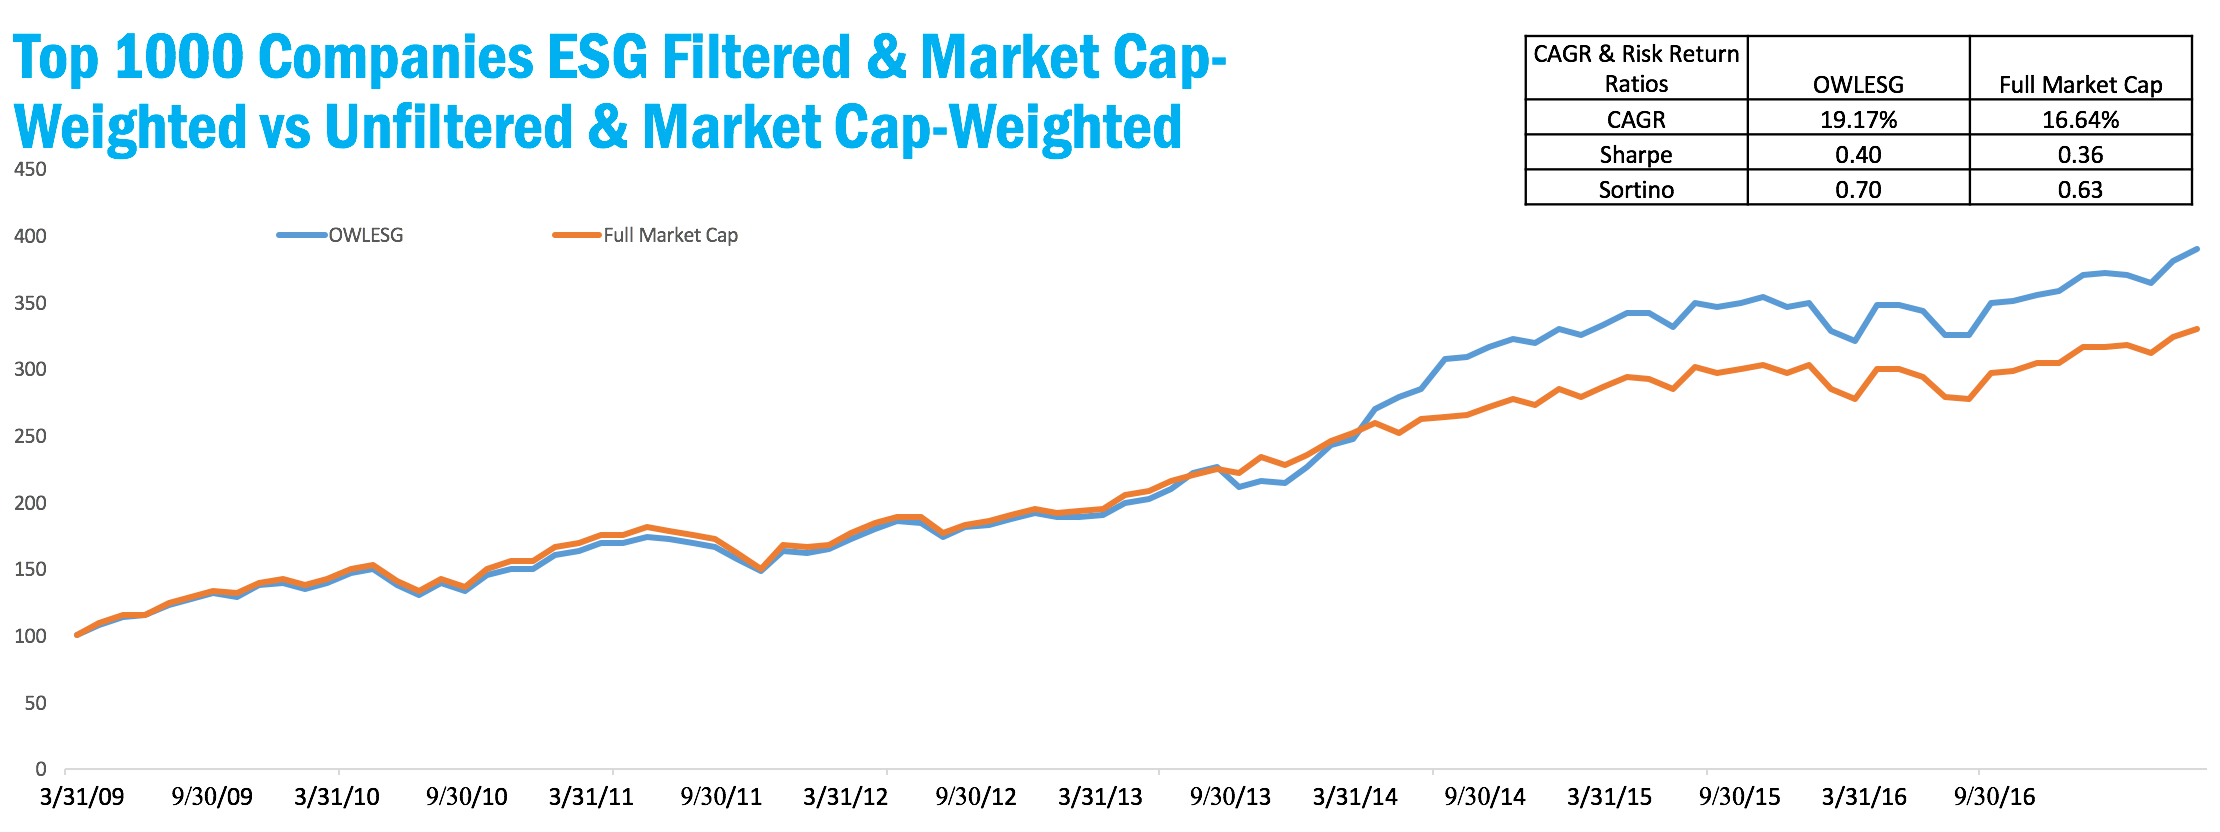
This week we use the same starting universe as our first two studies: the top 1000 US companies. The control portfolio, shown by the red line, is simply market cap-weighted. The blue line represents a portfolio which first filters companies below the median ESG score, then weights by market cap.
The ESG-filtered portfolio tracks the control portfolio fairly closely for the first four years, just slightly underperforming. After a mid-2013 dip, the test portfolio leapfrogs the control portfolio in early 2014, where it remains with a slow trend toward outperformance.
Disclosure: March 31, 2009 is the date that the OWL ESG historical database begins. The top 1000 US companies are not all covered in the OWL ESG database. Any companies not covered received a weight of 0.00% and their performance is not reflected in the OWL ESG-weighted simulated portfolio. Both portfolios for which the performance is displayed are simulated portfolios–they are non-investible models and no investible products track them; performance is based on simulated backtests. Factor exposures other than ESG score, such as market capitalization, valuation ratios, and momentum, also affect performance. Past performance is in no way indicative of future results.