
Like another recent test, today’s case study simulates the Top 1000 Value Index for a head-to-head between a market cap-weighted portfolio (red line) and a portfolio both filtered and weighted by ESG score (blue line).
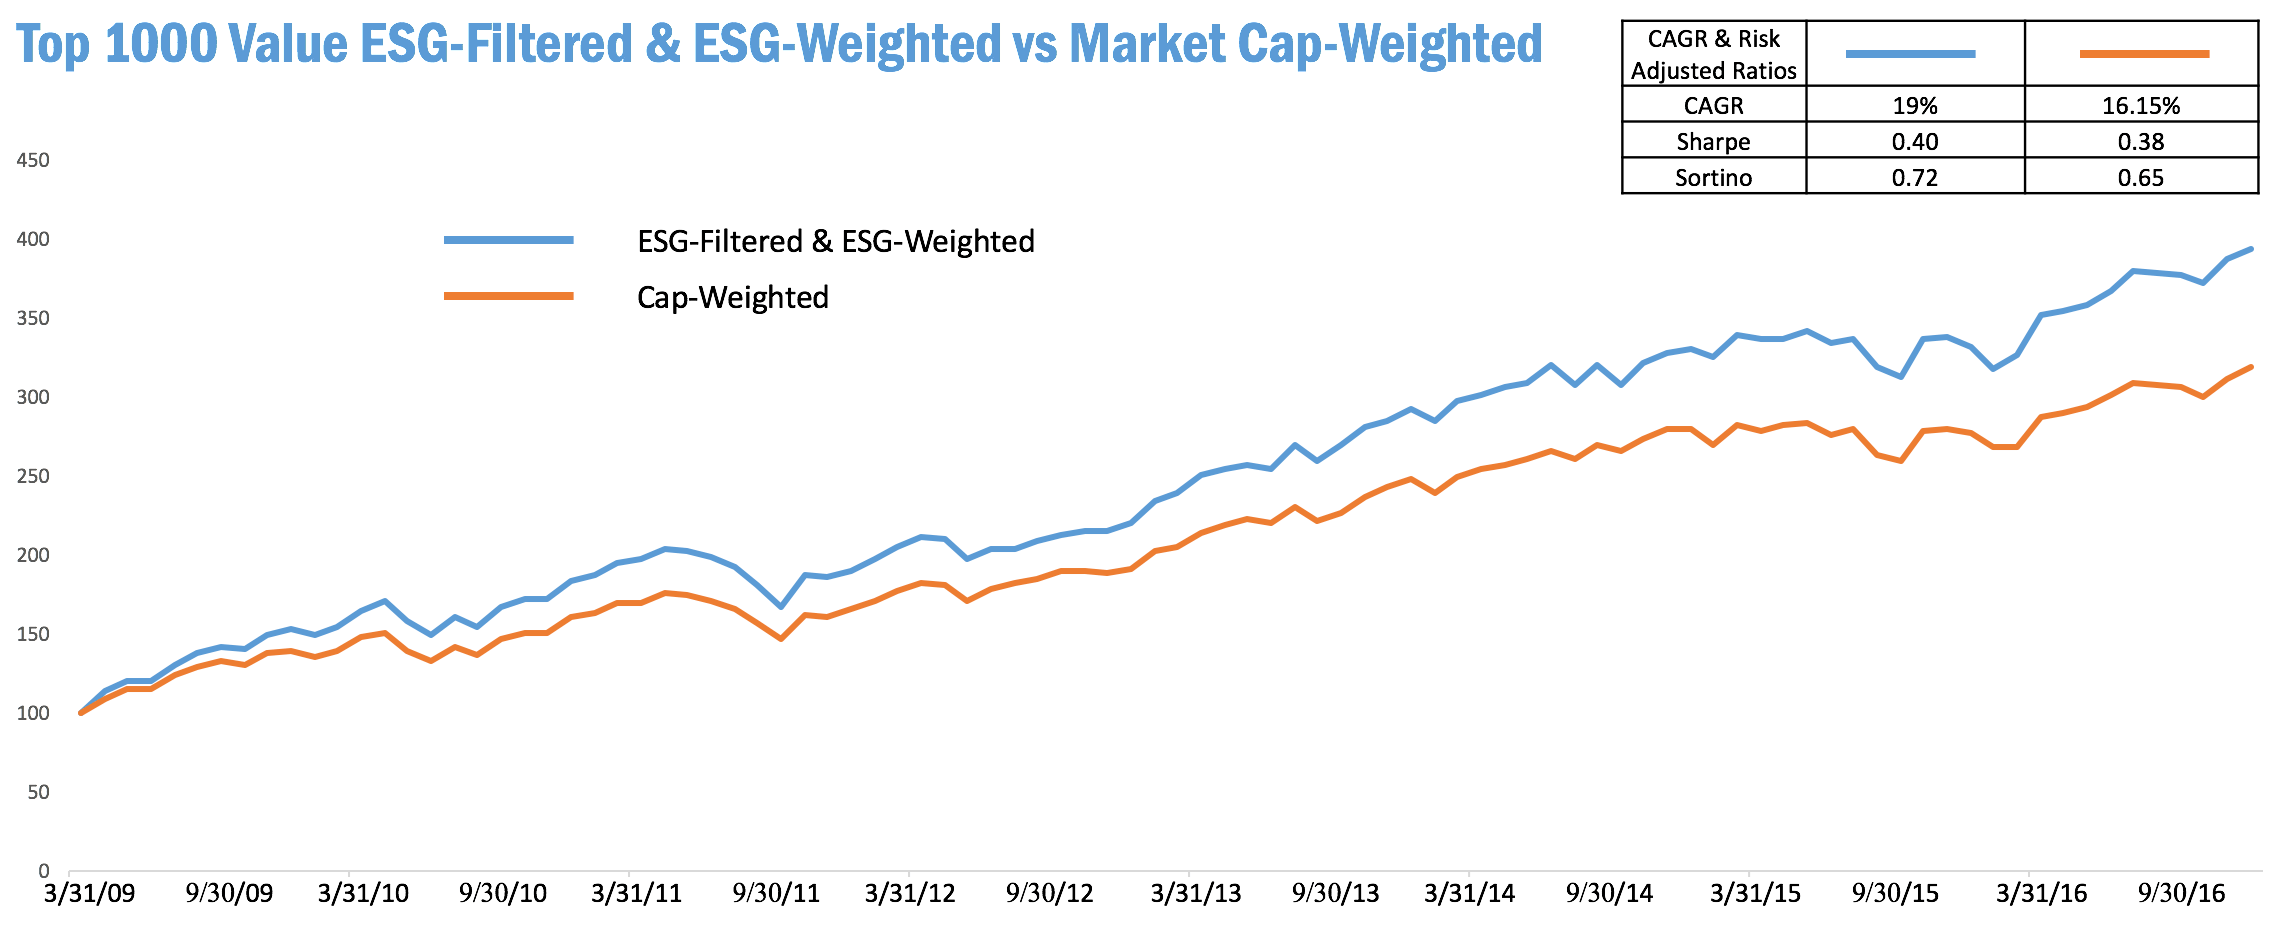
This starting universe’s portfolio didn’t perform quite as well as another similar head-to-head, using the same factors on just the top 1000 US companies. This Top 1000 Value Index showed higher risk and lower returns across the board.
But notably, the ESG portfolio still handily outperforms the cap-weighted control.
Seeing a pattern here? There are lots more coming your way soon. Sign up for our newsletter to get additional analysis and exclusive tips. And contact us if you’d like additional information on how to apply ESG to your particular investment needs.
Disclosure: March 31, 2009 is the date that the OWL ESG historical database begins. The top 1000 US companies are not all covered in the OWL ESG database. Any companies not covered received a weight of 0.00% and their performance is not reflected in the OWL ESG-weighted simulated portfolio. Both portfolios for which the performance is displayed are simulated portfolios; they are non-investible models; there are no investible products tracking them; performance is based on simulated backtests. Factor exposures other than ESG score, such as market capitalization, valuation ratios, and momentum have an effect on performance as well. Past performance is in no way indicative of future results.